The way businesses employ technical resources must change as both technology and businesses evolve. It has been a long and difficult journey to get to the point where we are reporting on the Microsoft data platform. Ten years ago, we utilized an application called SSRS, or SQL Server Reporting Services, to produce interactive scorecard results that resembled dashboards.
Power BI makes it easier to generate reports that are more graphic and interactive, in addition to modernizing and enticing the user experience. Power BI reports, on the other hand, are designed to be read with each page in a distinct browser window, allowing for the simultaneous analysis of all of the graphical components. Power BI reports aren’t meant to be printed out or spread out across many pages.
Although certain data may be exported to other formats like Excel, PDF, or PowerPoint, this was not Power BI’s intended use at the time of its development and is not expected to be the case in the future. SSRS/Paginated Reports, on the other hand, was created to make reports seem as if they were printed on paper pages with breaks and totals. Reports with pages may be exported into several formats without losing any of their excellent quality.
What is a Paginated Report in Power BI?
The reports with pages may be printed out and distributed. They are known as paginated because they are designed to look well on a single page. Even if the data is dispersed over many pages, they aggregate it into a single table and present it.
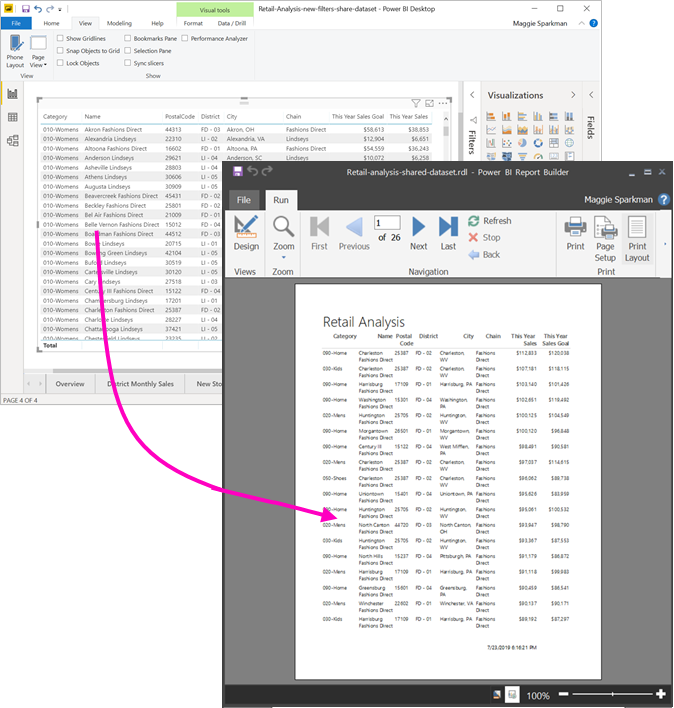
Because you have total creative control over each page’s design, some people refer to the report’s pages as “pixel flawless.” Power BI Report Builder is a standalone program that can be used to create reports for the Power BI service that contain several pages.
Why are Paginated Reports important?
The ability of paginated reports to print all of the information included in a table despite the table’s length is one of the many advantages offered by these reports. Consider inserting a table into a report created in Power BI. You can view some of its rows in the table that is shown on the website, and you can use the scroll bar to see the remaining rows.
If you export that page as a PDF or print it, the only rows that will print are the ones that you saw when you viewed the page.
Now, let’s imagine that you included the aforementioned table in a report that had pages. The paginated report will have the required number of pages when it is printed or exported to PDF. This will be the same number of pages regardless of how many rows are included in the table.
How to Read Pages in Reports
In order To reports with pages, SQL Server Reporting Services uses the Report Definition Language file. They are sometimes referred to as “Pixel Perfect” reports since you can alter how each page of the report looks. We may also include images and graphs in these reports. Paginated reports are the best solution to use when you need a fully organized, pixel-perfect output that is great for printing or creating PDFs.
The distinction between Paginated reports and Power BI reports
Paginated reports
The reports that include pages may be printed out and distributed to anyone interested. They are given the name “paginated” because they are formatted to appear nice on a single page. Even if the information is dispersed throughout a large number of pages, they compile it all into a single table and display it.
Power BI reports
A Power BI Report is a multi-perspective view of a dataset that includes visuals from a range of different views, along with visualizations that illustrate numerous discoveries and insights that may be obtained from the information. There can be a single photo on each page of the report, or there might be hundreds of photographs on each page. There is a possibility that, in addition to whatever else it is that you do for a living, you are also responsible for writing reports.
Do you need a paginated report?
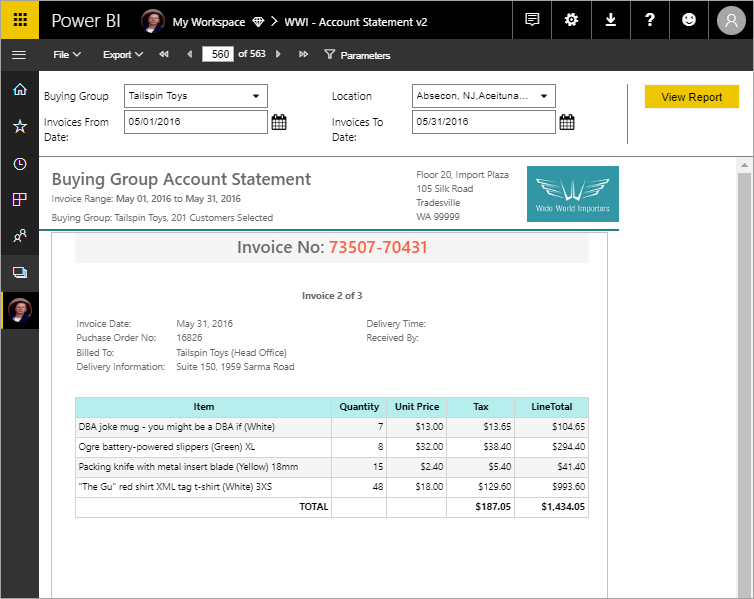
Power BI reports with pages are advised to be printed or converted to PDFs. Additionally, you may use them to produce layouts that are pixel-perfect and well-organized. This makes paginated reports—like sales invoices—ideal for use as operational reports.
Best Practice for Architecture: One Dataset to Rule Them All
Microsoft Azure serves as the foundation for the Power BI architecture. Power BI can connect to a wide range of various data sources. The Power BI Desktop program allows you to create reports and visuals based on the dataset. The Power BI gateway is linked to on-premises data sources, making it possible for it to continuously get data for reporting and analytics.
Why just approach a single project at a time? One of two methods is often used by companies or organizations to begin utilizing Azure DevOps:
a transfer of an existing on-premises Azure DevOps Server (also known as Team Foundation Server) project collection (s). High Fidelity tools like the TFS Migrator Tool are often used for this.
Organically refers to the formation of an Azure DevOps Organization by the company or organization, complete with a project. It will eventually be required to either create new ADO organizations or add more projects to the first ADO organization.
In the first article in the series, we examine the financial advantages of approaching your Azure DevOps journey from the perspective of “one company, one project.”
The Migration Tool, which enables us to duplicate and, more crucially, combines numerous Azure DevOps projects into a single project, is covered in Part 2 of this series.
We examine such issues in the third installment of this series, “Security Considerations and Techniques.” Each firm may have quite varied security requirements. It may even be a motivation to add another project, defying the “One Project to Rule Them All” maxim.
Power BI Report Builder
Users may construct multi-paged reports using the Power BI Report Builder software, which they can then submit to the Power BI service for publishing. Pages-containing reports are meant to be printed out and disseminated. They are structured to show all of the data in a table, even if it spans many pages while taking up as little space as possible on a page. To create a paginated report, you will need to create a report definition.
With the help of this report definition, the computer will be told what information to obtain, where to get it, and how to present it. When you run the report, the report processor creates the report by collecting the data, combining it with the report style, and presenting it using the report definition you gave. You may see a preview of your report at any moment in Report Builder.
Conclusion
Paginated reports from Power BI may be printed or converted to PDFs. Additionally, you may utilize them to create pixel-perfect layouts. Therefore, paginated reports work well with operational data like sales invoices. There are several methods to examine and use Power BI reports. Additionally, they may display your data utilizing a variety of eye-catching graphs and charts. As a result, Power BI reports are excellent for analytical reporting since they enable users to examine data and identify relationships and patterns.
In the end, both of these programs may be used to create various reports and offer various features, although one is superior to the other for particular jobs. Before attempting to push a reporting tool to its maximum, be sure it is the appropriate tool for the task. Consider how you may use Power BI interactive reports and paginated reports to fulfill your operational reporting demands as well as your analytical reporting requirements.
FAQs
Where can I find the instructions for creating a paginated report in Power BI?
Either the Power BI Desktop application or the Power BI service may be used to access your Power BI report. If you are already in the Power BI service, click the Edit button. Select the Paginated Report option found in the Visualizations window.
Are reports with pagination in Power BI free to use?
Without requiring a license, the Power BI Report Builder application may be obtained through the Microsoft Download Center at no cost. If the workspace in question is running Power BI Premium and you have to write access to the workspace, you will be able to publish and distribute paginated reports in your My Workspace as well as in other workspaces.
How can I create a report that is paginated?
- To create a paginated report using Power BI Report Builder, you only need to follow a few simple steps
- Open Power BI Report Builder
- Create a data source and configure it as follows:
- Create the Dataset for the Report
- Construct the Report Utilizing Pages
What does it mean to “paginate data”?
Creating distinct pages from material on a computer screen or piece of paper is a technique called pagination. Pagination also refers to the automated procedure of adding sequential numbers to indicate the sequence of the pages in print publications and certain online material.
Why is pagination necessary?
By using pagination, we can divide our big dataset into manageable “pages” that the user may see gradually. The database is not put under as much stress. Pagination may be used to solve several performance issues on both the client and server sides.